Urban Design Media
Academic | Spring 2025
Academic | Spring 2025
Location: New York City, NY
Software: ArcGIS Pro, StoryMaps
Loss of vegetation, along with rising urban heat, poses critical challenges in growing cities, directly affecting neighbourhood livability and residents' well-being. This study analyses the relationship between vegetation cover, surface temperature and neighbourhood conditions in New York City over the period from 2013 to 2023.
The purpose of this research is to examine the relationship between land surface temperature (LST), vegetation cover, and neighbourhood livability in New York City using GIS-based spatial analysis. The study assumes that there is a negative correlation between vegetation cover and surface temperature—that is, areas with more tree canopy or green space tend to experience lower LST. By analyzing NDVI patterns, LST distribution, population density, and housing vacancies, this research aims to test and either confirm or challenge this assumption. Additionally, it investigates how extreme surface temperatures may influence residential desirability and vacancy patterns at the neighbourhood level.
ANALYSIS
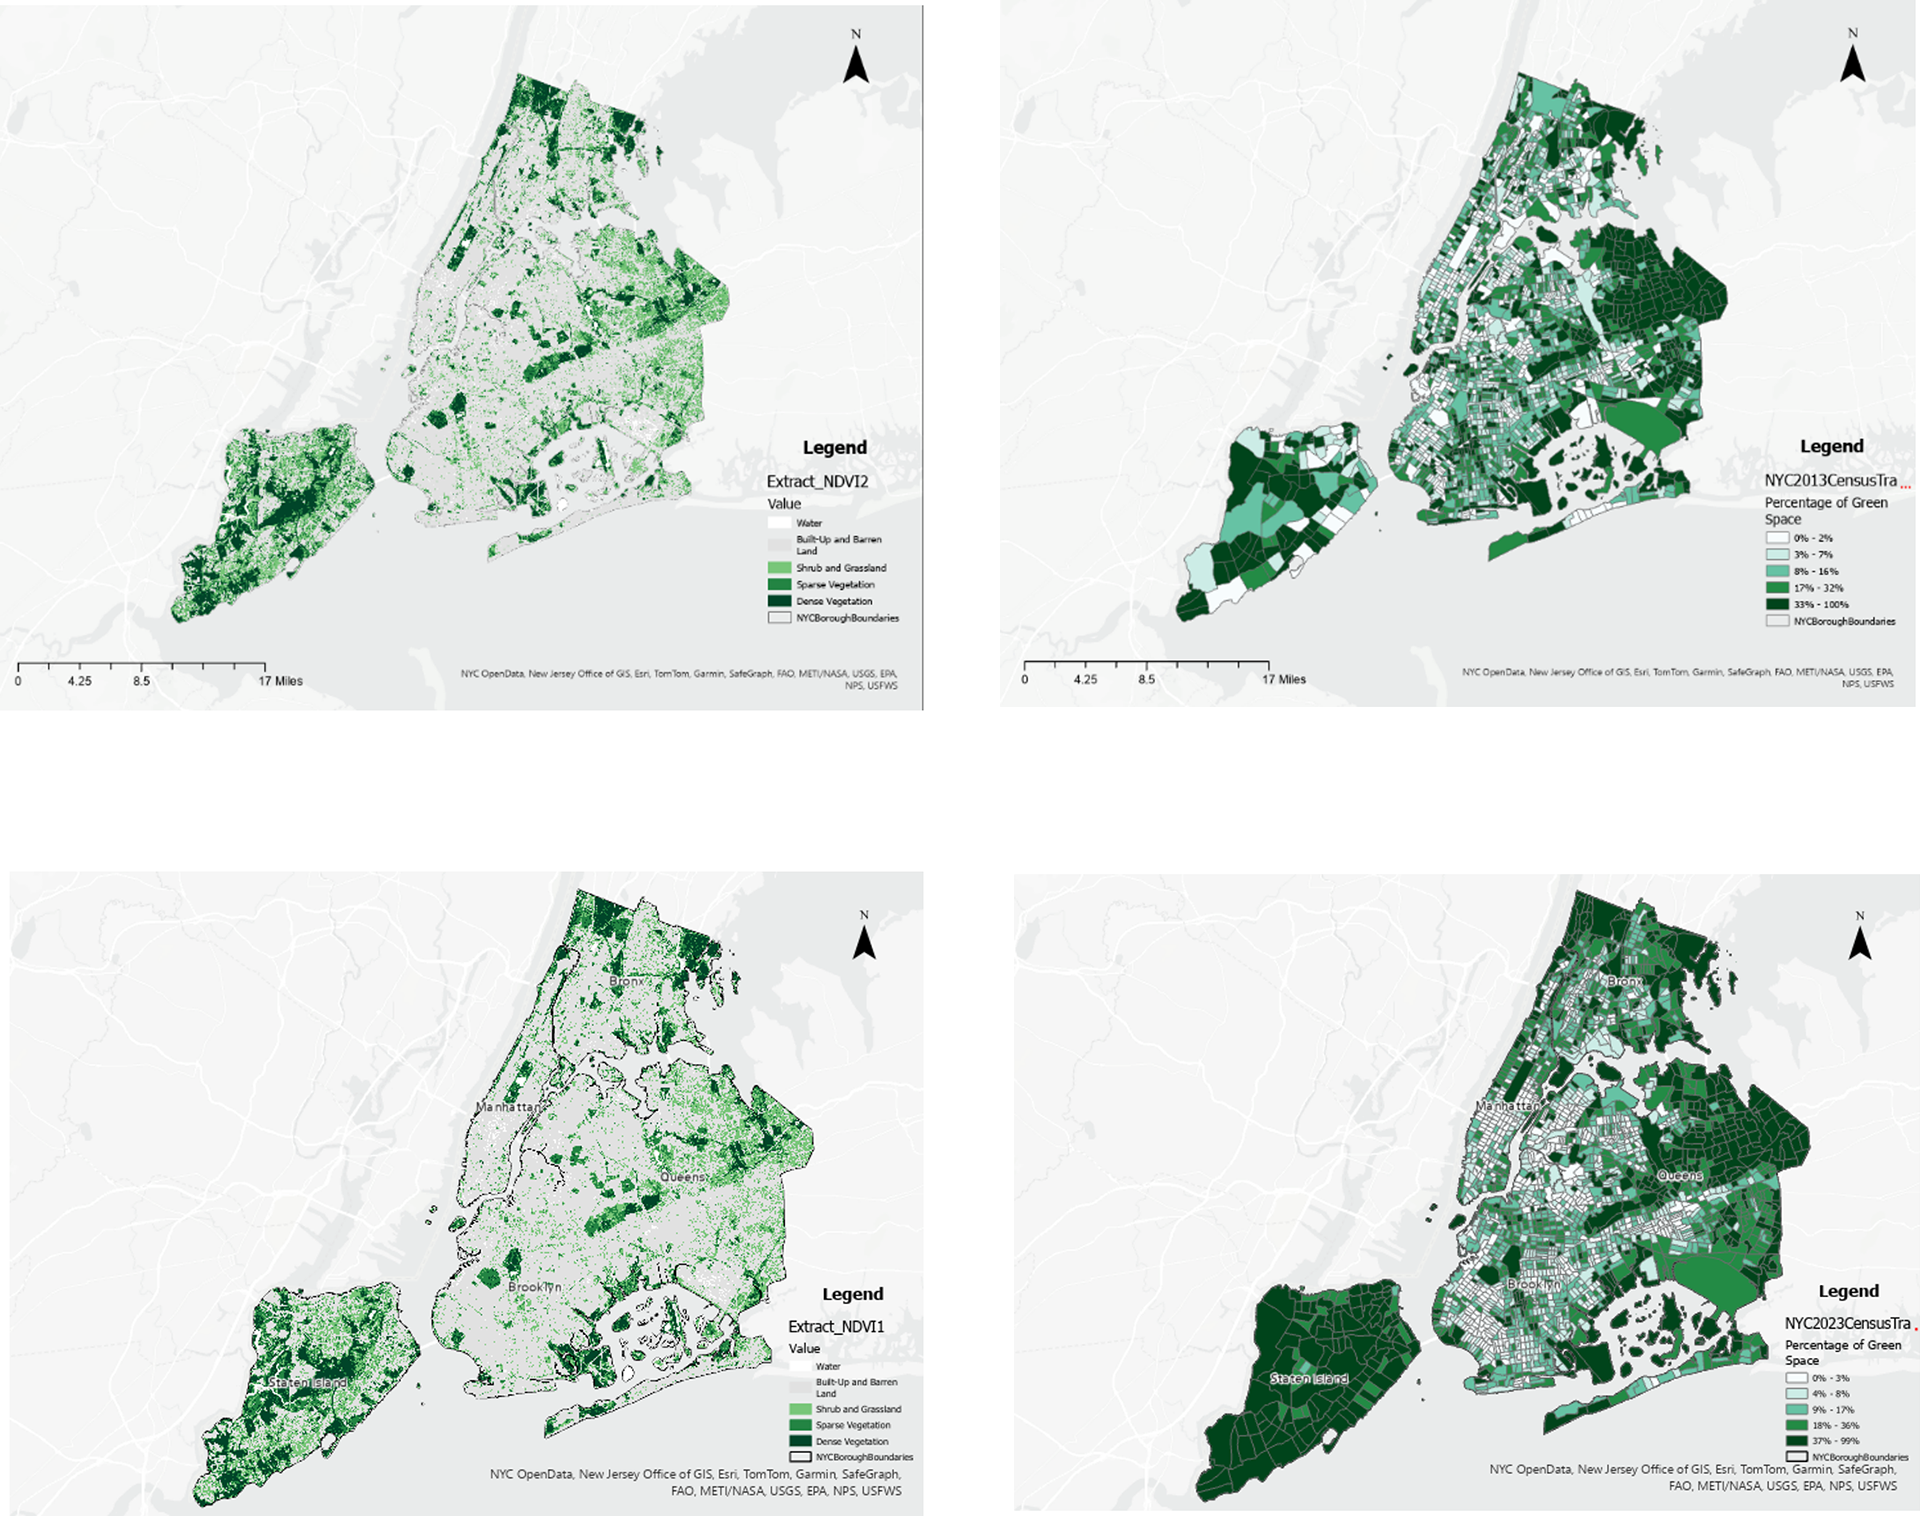
NDVI raster analysis and visualisation at census tract level for 2013 (above) and 2023 (below).
Following the initial NDVI analysis, an NDVI loss detection analysis was performed to assess the degree of vegetation loss between 2013 and 2023. This process also utilized Landsat imagery obtained from USGS Earth Explorer. The analysis focused on identifying areas where NDVI values decreased over time, with negative change values representing a loss of vegetation cover. Similar to the earlier step, the results were visualized at the census tract level to enable neighbourhood-level insights and to better understand the spatial distribution of vegetation decline across New York City.

NDVI loss from 2013 to 2023
The analysis then proceeded to generate Land Surface Temperature (LST) maps for both 2013 and 2023. Raster datasets were used to model and visualise the distribution of surface heat across New York City. A model was created to process the imagery and highlight spatial patterns in temperature variation in Fahrenheit.
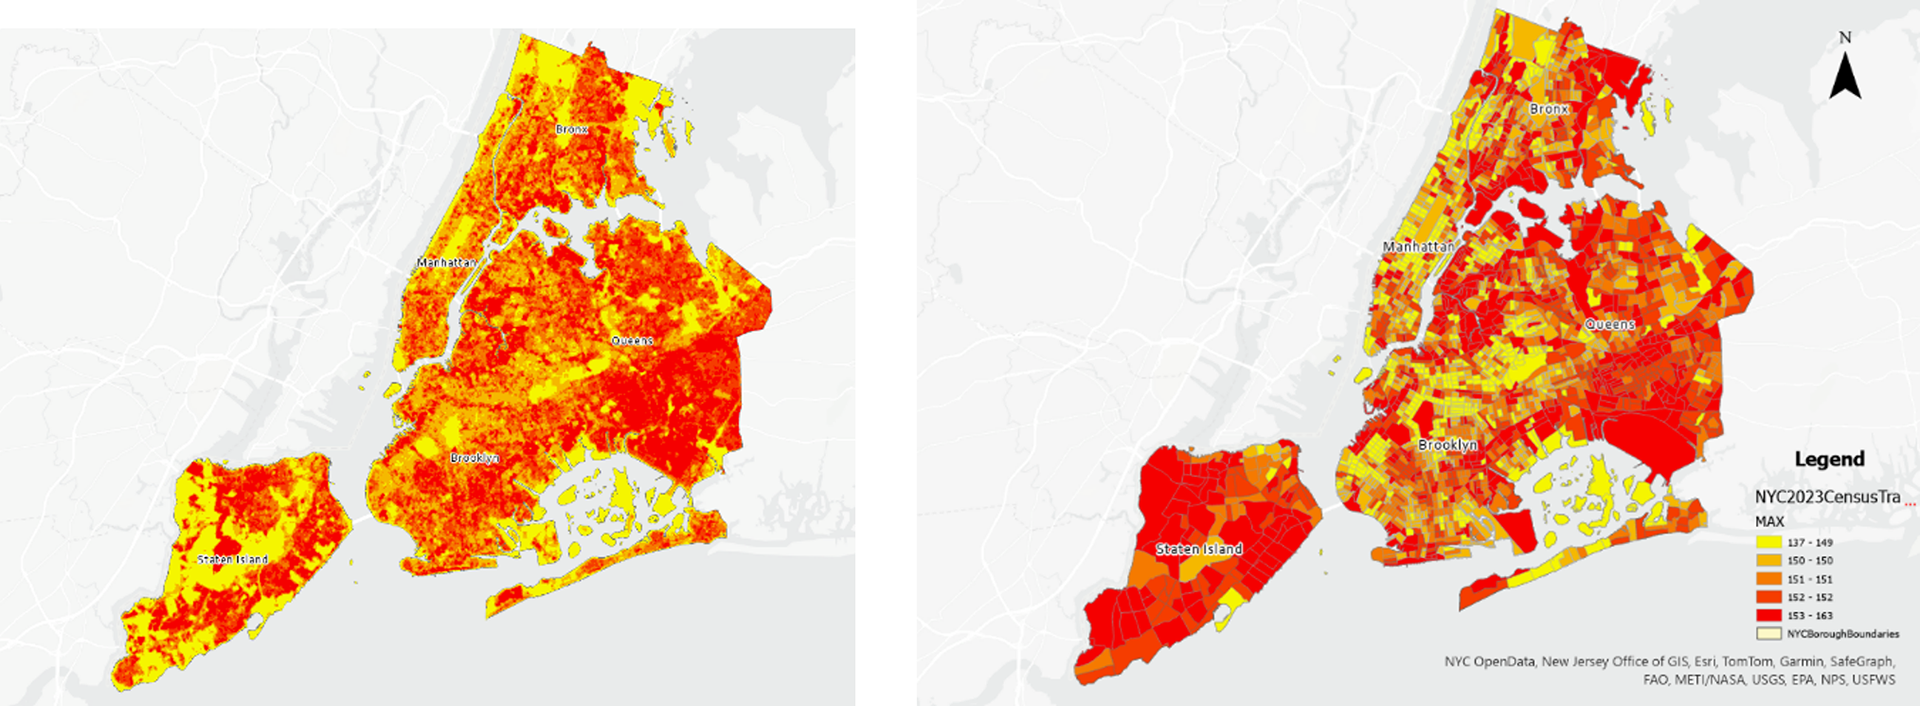
LST raster analysis through model builder and visualization at census tract level for 2023
Following the environmental analysis, demographic data, including population density, housing vacancies, and income levels, were overlaid onto the 2023 LST distribution map at the census tract level. This approach ensured the analysis remained relevant to the current public and environmental health scenario. By integrating these datasets, the study aimed to better understand which neighbourhoods within New York City are the most populated, gain insights into the socio-economic profiles of these communities, and assess neighbourhood quality through patterns of housing vacancies. Additionally, analysing income levels could also provide insight into the potential energy burden in these neighbourhoods, as lower-income areas may experience higher energy costs due to increased reliance on cooling to combat elevated surface temperatures.
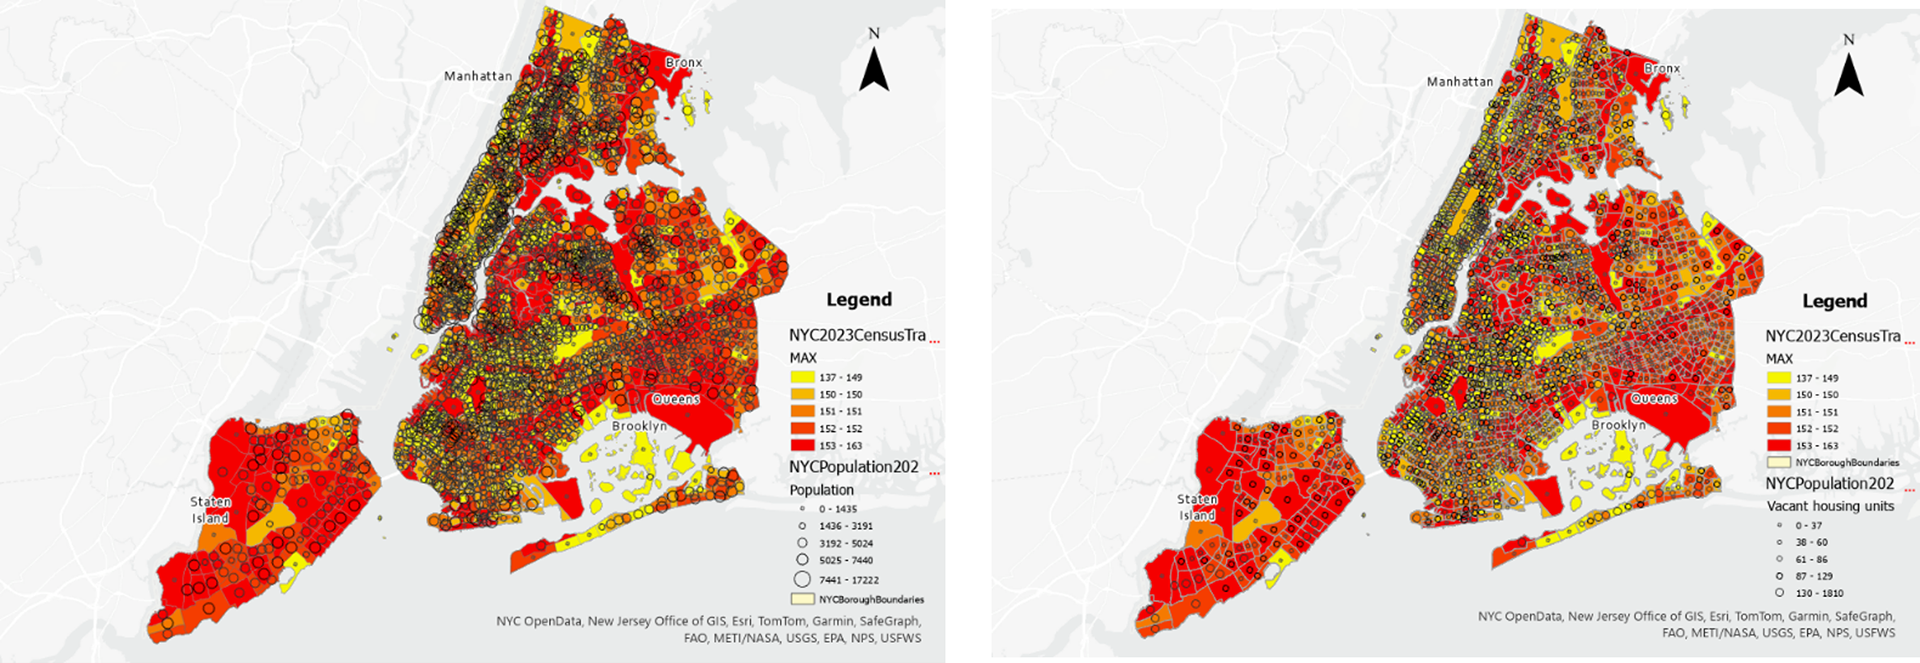
(Left to right): Map with population density overlaid on LST distribution; map with vacant housing units overlaid on LST distribution in New York City for 2023.
CONCLUSION
This research highlights the complex relationship between vegetation cover, surface temperature, and socio-economic factors in New York City. While overall vegetation loss from 2013 to 2023 was gradual, its widespread nature signals growing urban development pressures. Surface temperature patterns show that areas with reduced vegetation generally experience higher heat levels, reinforcing the cooling role of green infrastructure. However, discrepancies, such as high temperatures in green but sparsely shaded areas, point to the importance of vegetation type. The analysis also reveals that lower-income neighbourhoods are more vulnerable to higher surface temperatures and increased energy burdens. Environmental practices like reflective surfaces and efficient design have shown potential to offset heat even where vegetation is sparse. Overall, targeted interventions focusing on both green infrastructure and socio-economic resilience are crucial. These findings provide a foundation for more equitable urban planning strategies that improve neighbourhood quality and public health citywide.
More a more detailed analysis, please visit ArcGIS StoryMaps